Which TCG Is Growing Fastest? Market Cap by Game (September 2026)
Riftbound, One Piece, Dragon Ball, vintage Pokemon and Palworld compared on the Cardlogs Market Cap Index — 30-day growth on three marketplaces, plus how broad each rally really is.
Vintage Pokemon is growing fastest, on the only test that survives all three feeds. According to the Cardlogs Market Cap Index, vintage Pokemon rose 2.5% on TCGplayer, 2.8% on Cardmarket and 5.3% on eBay sold prices in the 30 days to September 11, 2026 — the only game of the five we track where every marketplace agrees on a gain. The largest single number on this page belongs to Riftbound, +14.0% on Cardmarket; its TCGplayer leg fell 2.0% over the same window.
That is a different answer from every previous edition of this article, and the reason is not that vintage Pokemon accelerated. It is that everything else stopped. Four of the five games now have a falling median card, all four TCGplayer-priced games have more decliners than gainers, and every index still printing a gain is carried by its top 1%.
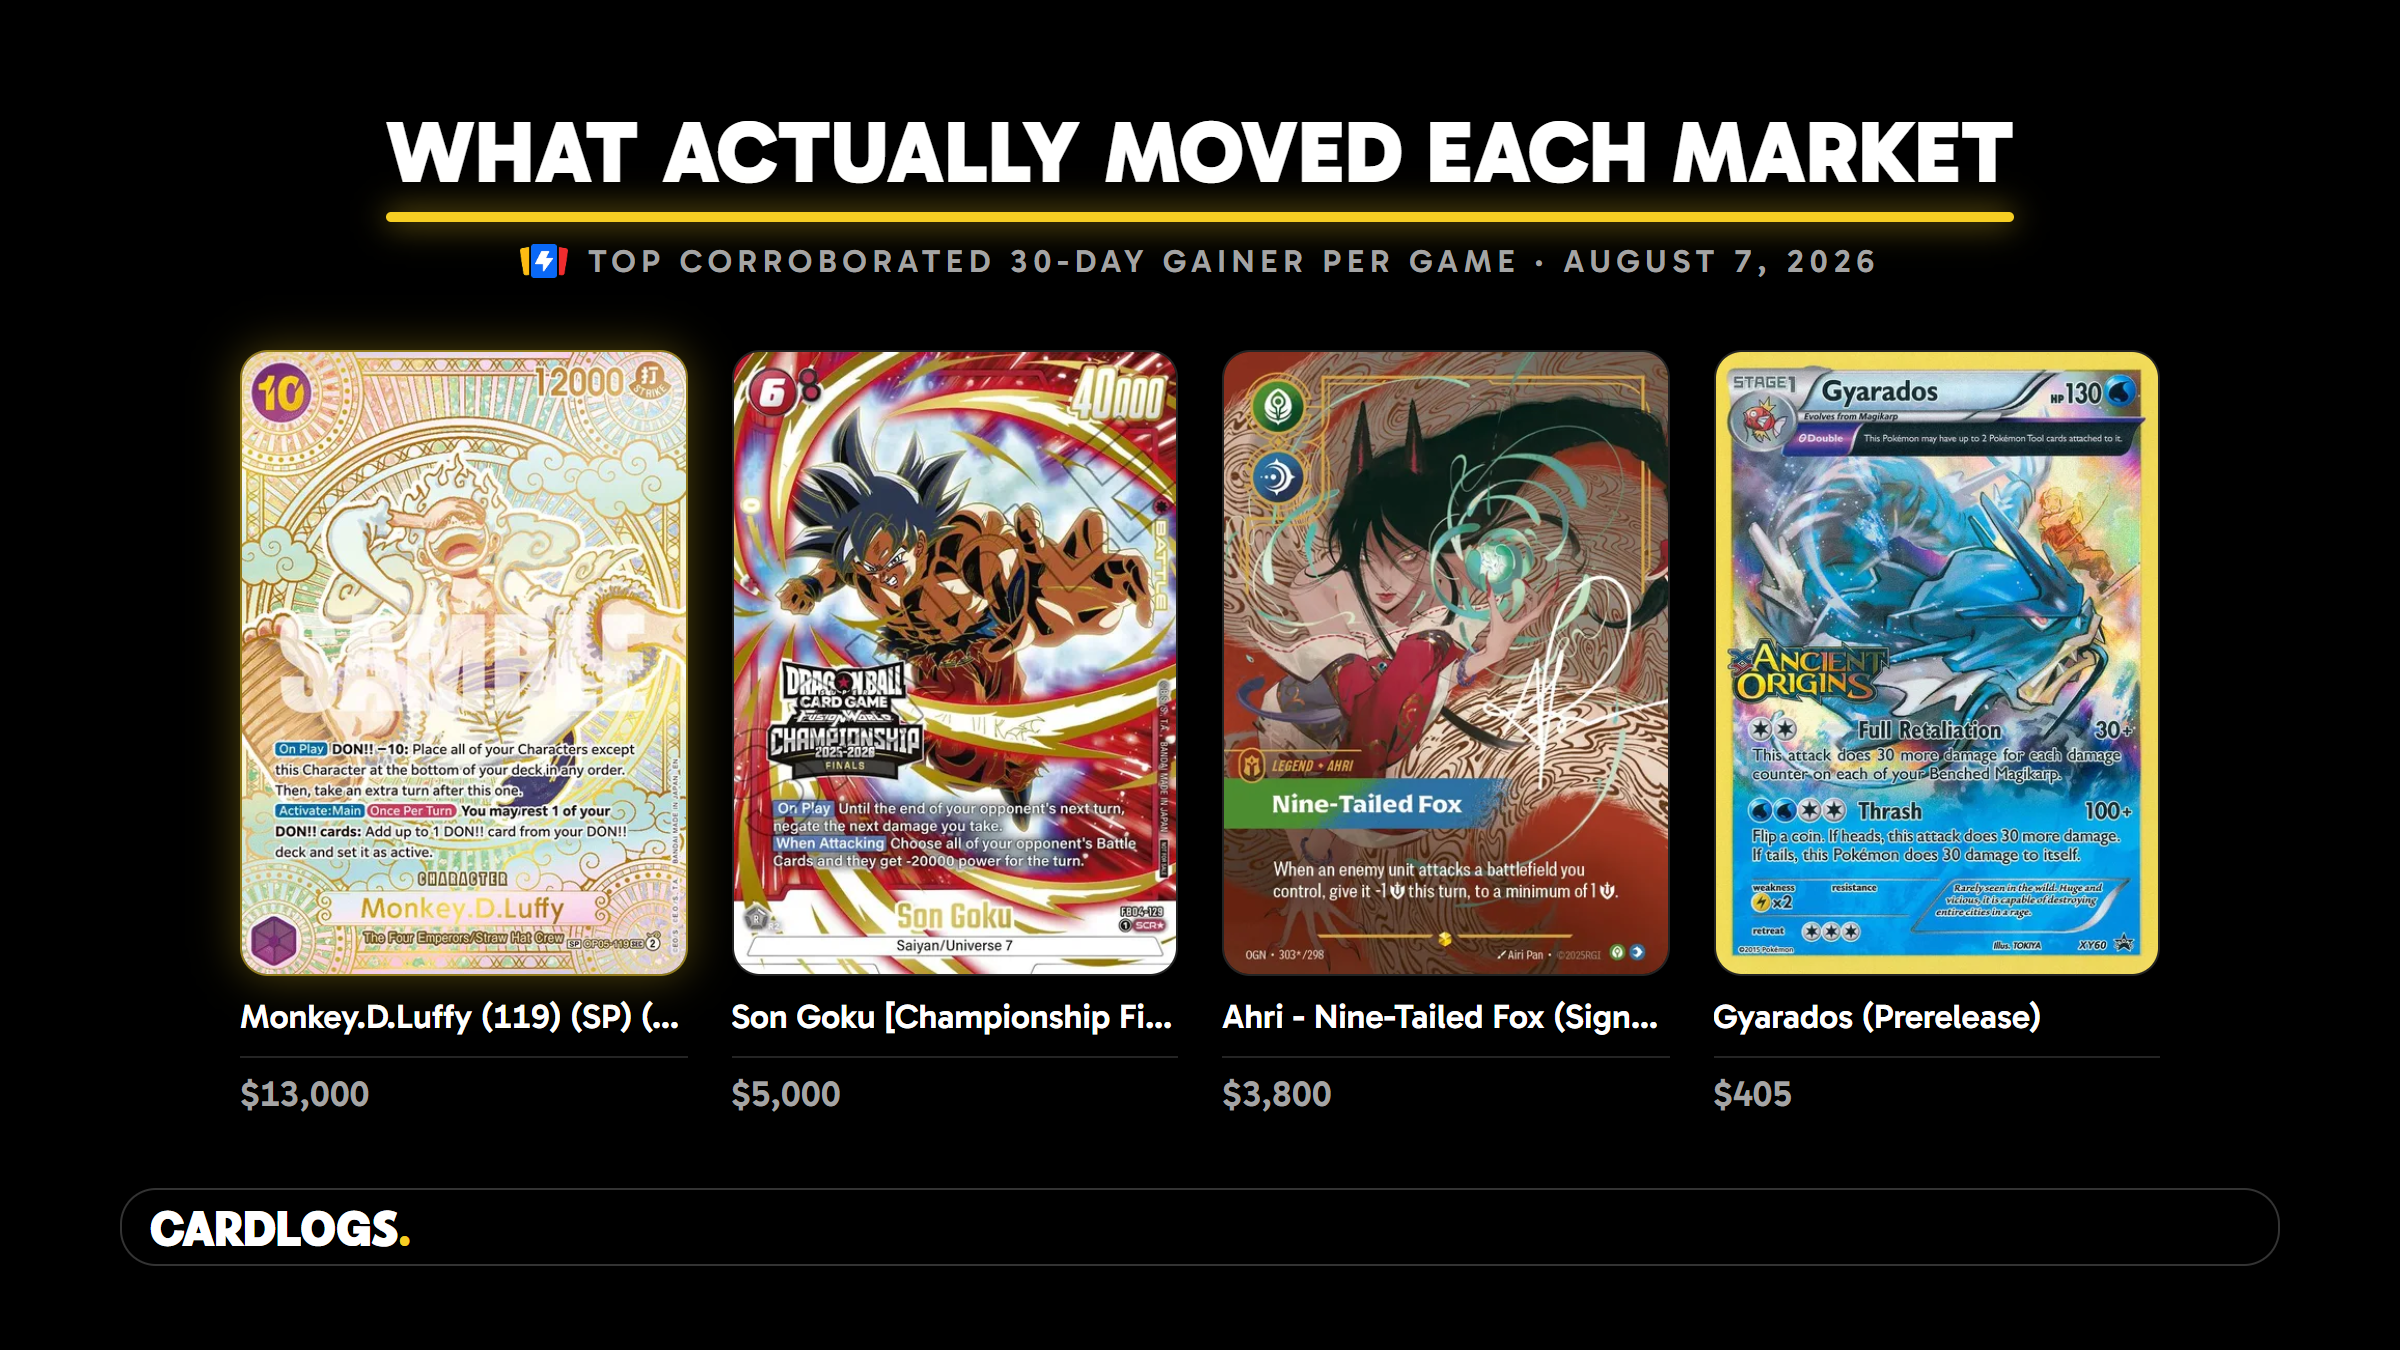
Which TCG is growing fastest right now?
It depends which marketplace you ask, and for the first time in this series that sentence is the answer rather than a caveat. Here is the 30-day change in the Cardlogs Market Cap Index to September 11, 2026, computed separately for each marketplace:
| Game | TCGplayer | Cardmarket | eBay sold | Positive feeds |
|---|---|---|---|---|
| Vintage Pokemon | +2.5% | +2.8% | +5.3% | 3 of 3 |
| Riftbound | −2.0% | +14.0% | +2.8% | 2 of 3 |
| Palworld | no feed | no feed | +4.5% | 1 of 1 |
| Dragon Ball | −0.1% | +3.8% | −1.5% | 1 of 3 |
| One Piece | −2.4% | +1.2% | −3.4% | 1 of 3 |
Three things stand out.
Riftbound's feeds have come apart. A month ago its three legs read +30.4% / +29.6% / +34.2% — a 4.6-point spread we called the strongest signal on the page. Today they read −2.0% / +14.0% / +2.8%, a 16-point spread, and the two that disagree most are the two ask feeds. European sellers are still raising prices; American sellers have stopped, and the sales feed has nearly stopped with them. Whatever is driving Riftbound's Cardmarket number is not visible on either American venue. The card-level version of that split is in the most expensive Riftbound cards.
Vintage Pokemon wins by not falling. +2.5% / +2.8% / +5.3% is the same modest pace it has printed since July; it leads because the field came back to it. This is the outcome the last edition hinted at when we wrote that slow-and-broad had outlasted fast-and-narrow — except that this month even vintage Pokemon's breadth has gone negative, which the section below covers.
Palworld is now measurable and it is positive. Seeded on August 12, 2026, it reached a full 30-night window on September 11 and prints +4.5% on eBay sold prices across 222 cards. That is second-fastest on the sales feed. It is still one feed, and one feed is not a market — see below.
What about Palworld?
Palworld entered the Cardlogs Market Cap Index on August 12, 2026, and as of September 11 it has its first complete 30-day reading: +4.5%, index 104.50, across 222 priced cards summing to $11,331.
One caveat still makes it a footnote rather than a co-equal row: Cardlogs prices Palworld from eBay sold data alone. There is no Cardmarket category for the game, and while TCGplayer the marketplace did create a Palworld product line on September 7, 2026 — which we noted the same week — that catalog is not in the Cardlogs nightly pipeline yet, so it corroborates nothing on this page. Every Palworld figure here is single-venue and sold-based. That is a real limitation and we would rather name it than let a second venue be assumed.
What Palworld does have is the cleanest measurement in the study: all 222 of its priced cards carried a same-card pair on the most recent link, a 100% pairing rate that only Dragon Ball's eBay leg matches. The newest and smallest market is the best-measured one, which is mostly a statement about how small it is. There is a fuller breakdown in the Palworld TCG launch guide.
Does the answer change over a longer window?
Yes — over the full history Riftbound still leads by a distance. Measured from the index seed on May 28, 2026 through September 11, 2026 (106 days):
| Game | TCGplayer | Cardmarket | eBay sold |
|---|---|---|---|
| Riftbound | +17.7% | +84.9% | +64.3% |
| One Piece | +27.4% | +28.3% | +12.5% |
| Dragon Ball | +25.7% | +19.7% | +5.7% |
| Vintage Pokemon | +10.9% | +17.7% | +15.2% |
The TCGplayer column in that table needs its correction stated plainly, because it changes the ranking. Our TCGplayer index carries a one-night artificial step on August 13, 2026, caused by a change in how we log TCGplayer prices, not by the market: link factors of 1.207 for Riftbound, 1.021 for Dragon Ball and 1.015 for One Piece on that single night. Every TCGplayer figure in this article — the 30-day table above and this one — is computed with that step removed. Read straight off the index, Riftbound's TCGplayer history-to-date would say +42.1% rather than +17.7%, and its 30-day figure would say +18.3% rather than −2.0%. The uncorrected numbers would have made Riftbound the runaway winner of this article. Vintage Pokemon's leg is unaffected (link factor exactly 1.000 that night), as are every Cardmarket and eBay figure on the page.
So over 106 days Riftbound leads on Cardmarket and eBay by a wide margin and sits last on TCGplayer — a shape that only makes sense if the US ask side gave back most of what it gained. That is exactly what the 30-day table shows happening now.
We still cannot answer the one-year version of this question. The Cardlogs Market Cap Index seeds at 100 on May 28, 2026, so every figure here is bounded by 106 days of history. The 1-year field in our own data is null, and we would rather say so than annualize a three-month trend.
How big is each market?
Vintage Pokemon, by roughly 3.4x the next game. These are the summed market prices of every card Cardlogs prices on each feed, as of September 11, 2026:
| Game | TCGplayer | Cards priced | Cardmarket | eBay sold |
|---|---|---|---|---|
| Vintage Pokemon | $2,231,943 | 43,960 | €309,352 | $395,082 |
| One Piece | $652,134 | 6,966 | €947,457 | $778,613 |
| Dragon Ball | $209,137 | 11,547 | €184,312 | $301,241 |
| Riftbound | $169,535 | 1,467 | €86,254 | $55,470 |
| Palworld | — | 0 | — | $11,331 |
For the first time in this series, the largest market is also the fastest-growing one. All summer the two ranked inversely; this month the small fast markets stopped and the big slow one did not.
Read these totals carefully, and never as a game's true market size. They are the sum of the cards we price, and coverage differs by feed. One Piece's Cardmarket total (€947,457, about $1,098,300 at the ECB rate of 0.86266 EUR per USD on September 11, 2026) is larger than its TCGplayer total, purely because Cardmarket lists 12,186 One Piece cards to TCGplayer's 6,966. A market cap on this page is a coverage-weighted sum, not a valuation of the game. That is exactly why the growth numbers above come from the chain-linked index instead of from these totals.
Is the growth broad, or is it a handful of cards?
This is the question the index cannot answer, and this month it gives the same answer for every game. For each game we took every English card with a TCGplayer price and a 30-day change, and asked what share of the cards that moved went up:
| Game | Share of movers up | Median move (cards ≥$1) | Top 1% share of all gains |
|---|---|---|---|
| Riftbound | 47.4% | −2.1% | 72.2% |
| One Piece | 44.3% | −4.3% | 76.0% |
| Vintage Pokemon | 42.7% | −0.4% | 85.7% |
| Dragon Ball | 37.2% | 0.0% | 84.6% |
Not one game has a majority of its movers going up, and not one has a rising median card. A month ago vintage Pokemon led this table with 61.8% of movers up and a +2.0% median; today it reads 42.7% and −0.4%. According to Cardlogs market data, every positive index figure on this page describes a gain that landed above the median card rather than on it.
The concentration column says the same thing from the other side. Riftbound is the least top-heavy market here at 72.2%, and that still means 14 cards out of 1,434 hold nearly three quarters of every dollar gained. The equivalents are 66 cards for One Piece, 111 for Dragon Ball and 242 for vintage Pokemon. Vintage Pokemon is now the most concentrated of the four at 85.7% — the reverse of last month, and the reason its headline win should be read as "least bad", not "booming".
Riftbound's middle is the healthiest thing left in it, which is an odd sentence about the game whose US ask index just went negative. 47.4% of its movers rose, the best of the four, while its index fell on two feeds. Both are true: the top gave back and the body did not.
Dragon Ball remains the most illiquid: 9,357 of its 11,073 priced English cards, 84.5%, recorded no 30-day change at all. That is why we report the movers-only share rather than a raw up/down split — a flat field can mean a stable price or a card nobody traded, and those are not the same claim.
How much of the growth does a second marketplace confirm?
We take the 20 cards contributing the most dollars to each game's 30-day gain and apply the standing Cardlogs corroboration screen: a card is confirmed when Cardmarket (converted at the day's ECB rate) or the eBay sold median lands within 30% of its TCGplayer price.
| Game | Top gainers corroborated | With no second venue at all |
|---|---|---|
| One Piece | 16 of 20 | 0 |
| Dragon Ball | 14 of 20 | 0 |
| Riftbound | 14 of 20 | 1 |
| Vintage Pokemon | 7 of 20 | 0 |
This is the confidence column for everything above it, and vintage Pokemon — winner of the growth table — still comes last, though it improved sharply from 3 of 20 a month ago.
Vintage Pokemon's top is the least corroborated market we measure. Its confirmed leader is a real and large number: Umbreon Gold Star at $9,840, up 122% in 30 days, with Cardmarket at 0.74x — the single biggest corroborated dollar gain in the entire study at $5,406. Its refusals are just as instructive: Rayquaza Gold Star asks $30,000 against Cardmarket at 0.27x and eBay sold at 0.49x; Moltres (H20) asks $1,250, up 270%, against a Cardmarket leg at 0.03x; Espeon (H9) asks $1,035, up 196%, at 0.04x. A 30x gap between two venues is not a price disagreement, it is two different objects or one imaginary listing, and neither belongs in a growth statistic.
So the two vintage Pokemon findings on this page still point in opposite directions and both are real: it is the only market rising on all three feeds, and its very top is the least verifiable. Averaging those into one "vintage Pokemon is up 2.5%" sentence is how a reader gets misled.
Riftbound's corroborated top is led by Akali, Rogue Assassin (Signature) at $4,150, up 56% in 30 days with Cardmarket at 0.77x — a $1,488 gain, the largest in the game that a second venue will stand behind. Its three biggest asks all fail the screen, and its single uncorroborated gainer is a Metal Prize Wall promo, an event-distributed card that only TCGplayer lists at all.
Dragon Ball's gainers are one tier and one tier only: Gold Energy Markers. Seven of its top twenty are [Gold] Energy Markers, and they split cleanly — E-81 at $924.50, up 116%, corroborates at 1.00x on Cardmarket, while E-87 (best leg 0.50x), E-62 (0.67x), E-61 (0.35x) and E-58 (1.36x, failing above) do not. Identical product tier, same 30-day window, opposite verdicts: the screen is separating listings from trades inside a single tier, which is the most useful thing it does.
One Piece is the best-corroborated market at 16 of 20 and also the one with the worst median card, which is the cleanest illustration on this page of what corroboration does and does not promise. Its top gainer, Tony Tony.Chopper (SP) at $4,174.22, up 32%, passes on its eBay leg at 0.96x. That tells you the $4,174 is real. It tells you nothing about the 2,986 One Piece cards priced above $1, whose median fell 4.3% in the same month.
What is the Cardlogs Market Cap Index?
The Cardlogs Market Cap Index is a chain-linked index, seeded at 100, that measures how the price of the same cards changed from one night to the next. Each night we compare only the cards that carry a price on both that night and the previous link date; cards that entered the catalog since then are excluded from that night's link factor and join the index from the following day.
That construction exists to defeat one specific error. A trading card catalog grows constantly — new sets, newly discovered listings, backfilled prices. Summing today's prices and comparing that sum to last month's sum measures how many cards we added at least as much as it measures the market. According to Cardlogs market data, a chain-linked index is the only honest way to state a percentage change across a population that is itself changing, which is why every growth figure on this page comes from the index and none comes from the market cap totals.
We compute it three times per game — once for TCGplayer, once for Cardmarket, once for eBay sold prices via PriceCharting — and never blend them. Two of those feeds are asks and one is completed sales; averaging them would hide the exact disagreement that makes Riftbound's number interesting this month.
Where this data comes from
Cardlogs aggregates prices nightly from TCGplayer, Cardmarket and eBay sold listings (via PriceCharting) across the 63,940 cards that carry a TCGplayer price in the four games with a TCGplayer feed, plus 222 Palworld cards priced from eBay sold data alone, plus PSA and BGS population data. Every figure on this page is from the nightly run of September 11, 2026 unless dated otherwise, read through the same get_all_tcg_market_caps endpoint that powers the market cap section on cardlogs.com.
Five limitations, stated rather than buried:
The August 13 TCGplayer step is corrected here, not hidden. A change in how we log TCGplayer prices produced a single artificial link factor on the night of August 13, 2026 — 1.207 Riftbound, 1.021 Dragon Ball, 1.015 One Piece, 1.000 vintage Pokemon. Every TCGplayer percentage in this article divides it out. Uncorrected, the 30-day column would read +18.3% Riftbound, +2.0% Dragon Ball and −0.9% One Piece instead of −2.0%, −0.1% and −2.4%. We publish the corrected figures and the size of the correction together, so the number can be checked rather than trusted.
eBay sold coverage varies enormously by game, and the thin legs are the loud ones. The share of each game's priced cards that carried a same-card pair on the most recent eBay link: Dragon Ball 100% (12,165 of 12,168), Palworld 100% (222 of 222), One Piece 29% (2,582 of 8,866), vintage Pokemon 22% (4,746 of 21,439), Riftbound 17% (153 of 914). Riftbound's +2.8% eBay figure rests on the smallest sample in the study.
Market cap totals are coverage-weighted sums, not valuations, as described above. Cardmarket figures are native EUR and were converted at the ECB reference rate of 0.86266 EUR per USD on September 11, 2026 only where a USD comparison is made.
Palworld has one price feed. No Cardmarket category exists for it, and although TCGplayer created a Palworld product line on September 7, 2026, it is not in the Cardlogs pipeline — so no corroboration is possible on any Palworld figure on this page.
The history is 106 days. The index seeds at 100 on May 28, 2026. There is no one-year figure in this study because there is no one-year figure in our data.
The breadth screen uses tcg_delta_1M on English-language rows only, to avoid double-counting the Japanese and English prints of the same card, and reports movers-only shares because a zero can mean "unchanged" or "untraded". The median column covers cards priced at $1 or more, so that sub-dollar commons rounding on a one-cent tick do not swamp it.
The short version
- Fastest growing (30 days): vintage Pokemon, +2.5% / +2.8% / +5.3% — the only game positive on all three feeds.
- Largest single figure: Riftbound on Cardmarket, +14.0% — against −2.0% on TCGplayer and +2.8% on eBay. Its feeds went from a 4.6-point spread to 16 points in a month.
- Largest market: vintage Pokemon, $2.23M across 43,960 priced cards — now the biggest and the fastest, reversing all summer.
- Broadest rally: none. All four TCGplayer-priced games have more decliners than gainers among movers, and no median card is rising.
- Most concentrated: vintage Pokemon, 85.7% of gains in the top 1%. Least: Riftbound at 72.2%, which is still 14 cards.
- Best corroborated: One Piece (16 of 20 top gainers). Weakest: vintage Pokemon (7 of 20, up from 3).
- Palworld printed its first full 30-day reading: +4.5%, on one feed and 222 cards.
If you only take one thing: this is the first month in this series where no game's median card went up. The indexes that are still green are green because of a few dozen cards each. A market cap number without a breadth number beside it will tell you a game is booming when the typical card in it is falling — and right now that is every game on the page.
Cardlogs tracks all five of these markets nightly across TCGplayer, Cardmarket and eBay sold prices, on web, iOS and Android. You can follow the index for each game on its home page — Riftbound, One Piece, Dragon Ball, Pokemon and Palworld — or start from the TCG market tracker overview.
Frequently asked questions
Which trading card game is growing fastest in 2026?
Vintage Pokemon, on the only test that survives all three feeds. According to the Cardlogs Market Cap Index, vintage Pokemon rose 2.5% on TCGplayer, 2.8% on Cardmarket and 5.3% on eBay sold prices in the 30 days to September 11, 2026 — the only game of the five where every marketplace agrees on a gain. Riftbound owns the single largest figure on the page, +14.0% on Cardmarket, but its TCGplayer leg fell 2.0% over the same window.
Which TCG has the largest market cap?
Vintage Pokemon, by a wide margin. The 43,960 vintage Pokemon cards Cardlogs prices on TCGplayer sum to $2,231,943 as of September 11, 2026 — about two thirds of the $3.26 million total across the games we track on that feed. It is now both the biggest market and the fastest-growing one, which reverses the pattern this series reported all summer.
Is Riftbound still the fastest growing TCG?
No, not on every feed. In the 30 days to September 11, 2026 Riftbound's Cardlogs Market Cap Index rose 14.0% on Cardmarket but fell 2.0% on TCGplayer and rose only 2.8% on eBay sold prices — a 16-point spread. A month earlier all three legs read between +30% and +34%. The European ask side is still climbing; the US ask side and the sales side have stopped.
Which TCG has the broadest rally?
None of them, as of September 11, 2026. Every game we price on TCGplayer now has more decliners than gainers among the cards that moved — 47.4% up for Riftbound, 44.3% One Piece, 42.7% vintage Pokemon, 37.2% Dragon Ball — and every median card priced above $1 is flat or down. Every index still printing a gain is being carried by its top 1% of cards, which hold 72% to 86% of all dollars gained.
What is the Cardlogs Market Cap Index?
A chain-linked index, seeded at 100, that measures how the price of the SAME cards changed from one night to the next. Cards that entered the catalog since the last reading are excluded from that night's link, so a game's index cannot rise simply because we started tracking more cards. It is computed separately for TCGplayer, Cardmarket and eBay sold prices.
Why do the three marketplaces disagree about a game's growth?
Because two of them are asking prices and one is completed sales. TCGplayer and Cardmarket show what sellers want; the eBay leg shows what buyers actually paid. When asks rise and sales do not, the gap is the market disagreeing with itself — Riftbound is the clearest case in September 2026, up 14.0% on Cardmarket while TCGplayer printed −2.0%.